Nothing in small caps confuses new traders faster than the first time their stock simply... stops. No quotes, no fills, frozen. This lesson explains the machinery that pauses trading, why a chain of upward halts is the most powerful momentum signal this niche produces, and why the same machinery is the single best argument for small position sizes. The case study is a day from our own board: $PLAG, August 11, 2026.
The circuit breakers: LULD in plain language
Every US stock trades inside invisible Limit Up-Limit Down (LULD) bands: a percentage corridor around a rolling reference price (roughly the last five minutes of trading). If price tries to leave the corridor and stays pinned at the band edge for 15 seconds, the exchange calls a 5-minute trading pause.
- Band width depends on the stock: large liquid names get tight bands (~5%); most small caps get ~10%; stocks under $3 get ~20%; and below $0.75 the band is the lesser of 75% or $0.15. The corridors widen further near the open and close.
- LULD runs ONLY during regular hours, 9:30 AM to 4:00 PM ET. There are no bands and no pauses before the open or after the bell. That single fact explains both ends of the case study below: $PLAG travelled from $0.63 to $1.68 in premarket with nothing to stop it, and then lost 79% after 4:00 PM with no circuit breaker anywhere in the way.
- The practical translation: a fast 10-20% move in minutes = a likely halt. On runner days, that threshold gets hit repeatedly.
- Two other pause types you will meet: news halts (company requests a stop pending an announcement: can last hours) and T12/regulatory halts (the exchange has questions: can last days, and reopens are frequently brutal). Know which kind you are in before assuming a 5-minute wait.
During the pause, orders can typically be placed and canceled but nothing executes; the exchange then reopens the stock with an auction that matches accumulated orders at a new equilibrium price. That reopen print is why halted stocks "teleport."
Why a halt chain UP is the strongest signal on the tape
Think in auction terms (Lesson 0.1): a halt up means demand hit the band faster than supply could absorb it, and the market needed a timeout to find sellers. During those five minutes, attention COMPOUNDS: the halt itself tops scanners, traders who missed the first leg queue orders for the reopen, shorts trapped underneath plan their exits (which are buys, Lesson 1.4). If the reopen auction clears higher and the stock immediately runs to the next band, the imbalance is still unresolved: that is a halt chain, and each link is the market saying "still not enough sellers at these prices."
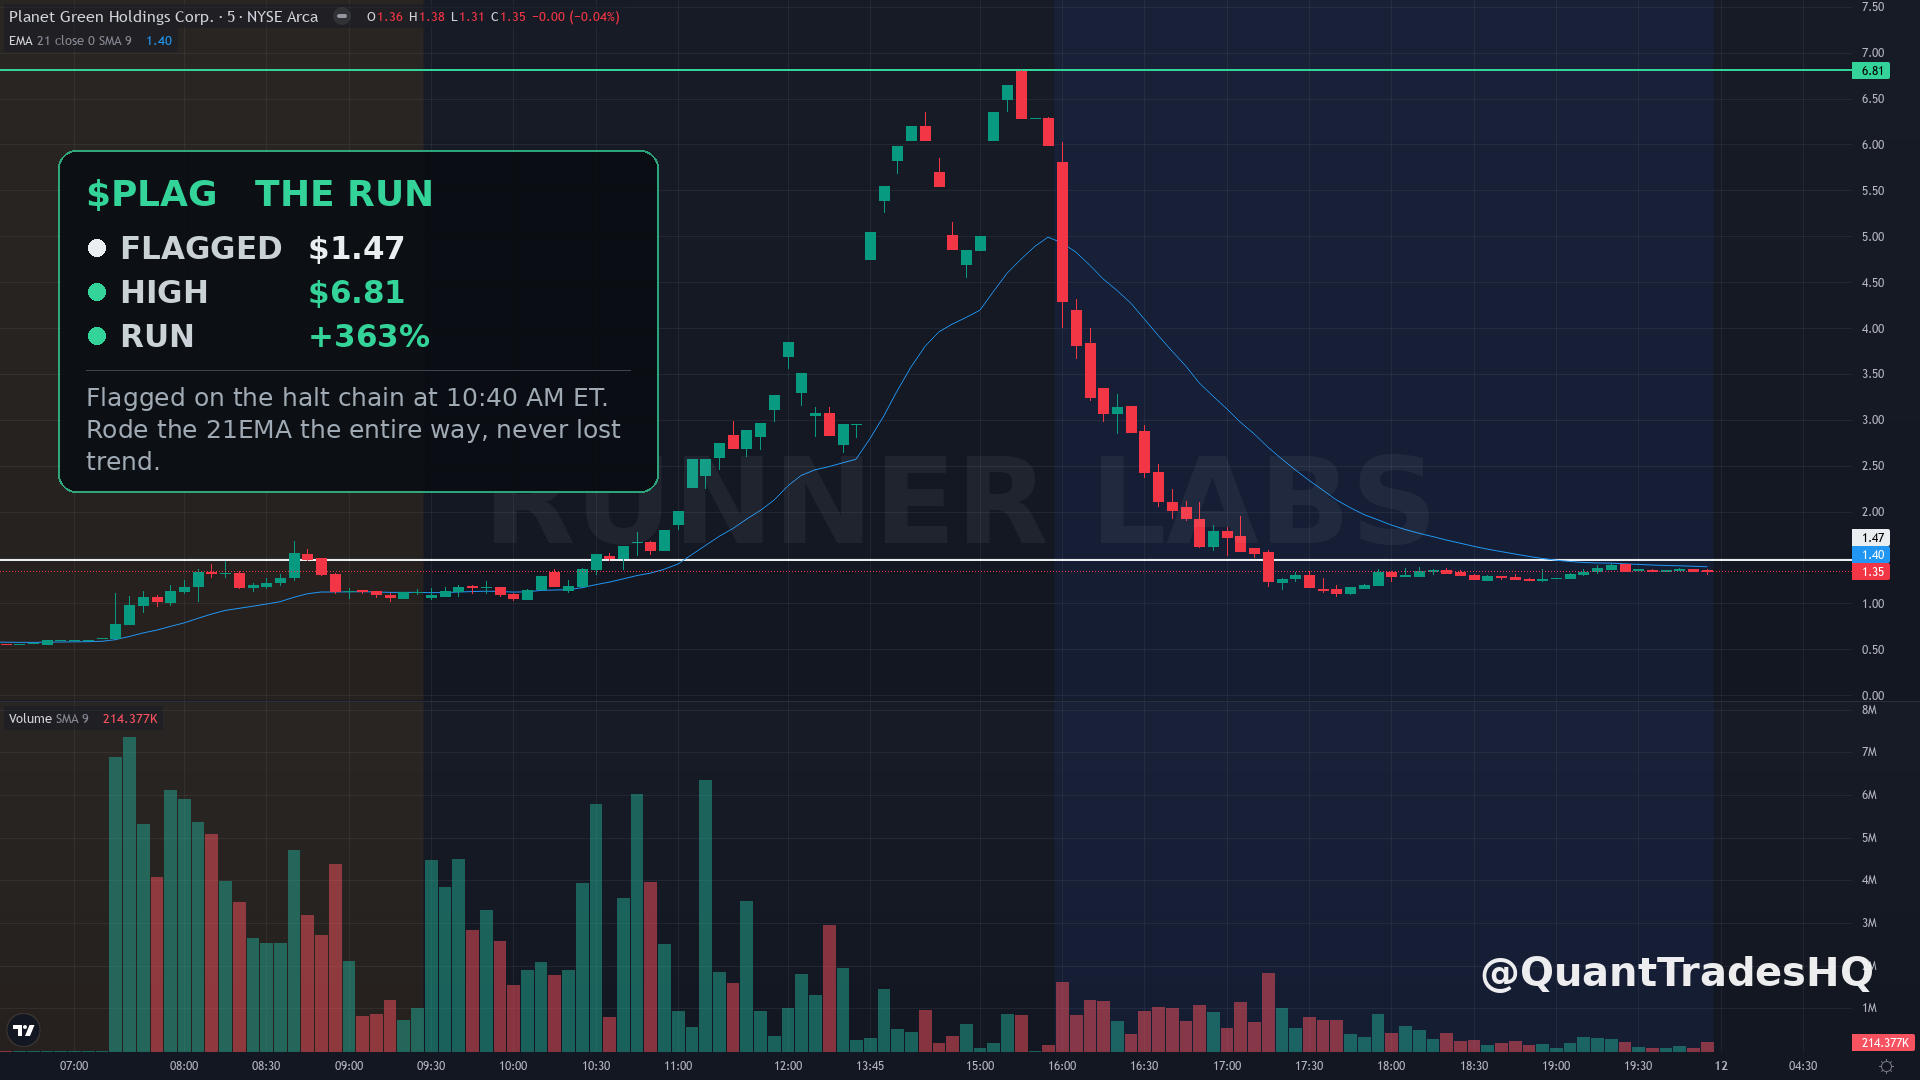
The $PLAG timeline, hour by hour
Premarket: news hits 7:35 AM, $0.63 to $1.68 by 8:40, back to $1.09 by 9:10
9:30 open: $1.07, +88% on the prior close
9:35-10:00: chops $1.03-$1.24 on about 22M shares in the first thirty minutes, against a 3.8M prior-20-day average FULL day
10:40 AM: our flag fires at $1.47, above VWAP, volume expanding (session high at that moment: $1.55)
11:00 AM: $2.01 → halt → reopens $2.42, runs $2.57
12:00 PM: $3.85, then a round trip back to $2.74 by 12:35
12:45-1:40 PM: extended pause, reopens at $4.90
2:15 PM: $6.35, then fades to $4.70 by 2:55
3:05-3:20 PM: pause, reopens $6.20
3:35 PM: $6.81, high of day, +363% from flag, +1,095% on the prior close
4:00 close: $5.81
213,654,200 shares on the day, about 56x the prior 20-day average
Every concept from this module is in that timeline: the fresh-news gapper (1.2), time-adjusted volume screaming before 10 AM (1.3), a tiny rotating float (1.4), and the halt ladder amplifying each leg (this lesson). Runners are not many separate phenomena: they are one phenomenon wearing five instruments.
Three things in that day that the tidy version leaves out
Our flag was not a fresh high of day. The session high at 10:40 was $1.55, eight cents above where we flagged, so the entry was a continuation into expanding volume, not a breakout print. If you are waiting for the exact high to be taken before you act, you will spend most of these days waiting.
The ladder was not monotonic. There were two full round trips inside the run: roughly 29% off the noon high back to $2.74, and roughly 26% off the 2:15 high back to $4.70. Either one shakes out a trader holding a number in their head instead of a rule, and the second one happened less than an hour before the high of the day printed.
And the volume did not climax at the top. The three largest 5-minute volume bars of the session were 11:25 (6.6M shares), 10:45 (6.35M) and 10:30 (6.08M), all mid-morning. The bar that made the $6.81 high at 3:35 did 897,869 shares. Volume climaxed four hours before price did. That is the divergence from Lesson 0.2 in its real, inconvenient form: attention peaks early, price keeps grinding on thinner and thinner participation, and the last leg is the loneliest one.
The ending, which is the actual lesson
The bands that paused this stock repeatedly during the session stopped existing at 4:00 PM. Nothing slowed the exit. A trader who did everything right all day and then decided to "hold it overnight for the gap" gave back the entire trade between the close and dinner, and the stock has never come back. This is the fade from Lesson 1.1 with no circuit breaker attached, and it is why our rule is an intraday trail: at +5% the stop moves to entry, then trails 15% off the high, and the trade is over when the trail is hit, not when the session is.
The mirror: what halts cost you
Trading around halts: the honest guide
- Before the first halt: the cleanest entries exist here: confirmation triggers (our flags) with normal stop mechanics still functioning.
- During a halt: plan, do not queue market orders. Decide your add/trim/exit prices for both a gap-up and a gap-down reopen. The five minutes are for thinking, most participants spend them refreshing X instead.
- At reopens: the first 30 seconds are algorithmic chaos (Lesson 0.1's players at their fastest). Let the auction print settle; a reopen that holds its opening range is information, a reopen that instantly fades below it is a verdict.
- Late in a chain: each successive halt raises the odds you are buying someone's exit. Pair the chain count with climax-volume signs (1.3): chains die at maximum participation.
- LULD pauses trading ~5 minutes when price pins a band (~10% for most small caps, ~20% under $3, the lesser of 75% or $0.15 below $0.75), and only between 9:30 and 4:00: premarket and after-hours have no brakes at all.
- A halt chain up = repeated unresolved demand: the strongest momentum signature on the tape.
- Reopens are auctions: let the print settle; holding vs fading the reopen range is the tell.
- You cannot exit inside a halt: size for a 20-30% adverse reopen gap, not for your drawn stop.
- Late chain + climax volume = you are likely the exit liquidity. Count the links.
Drill: replay a halt ladder
Take any recent halt-chain day (our board logs them weekly) and replay the 1-minute chart. Mark every halt and its reopen print. For each link, write what a holder felt (frozen, up big, unable to act) and what a chaser who bought the reopen paid versus the next 30 minutes. Then compute: if you had entered at our flag price with our flat 12% stop, where would a mid-ladder halt-down have ACTUALLY filled you? That last number is why the sizing rule exists.